
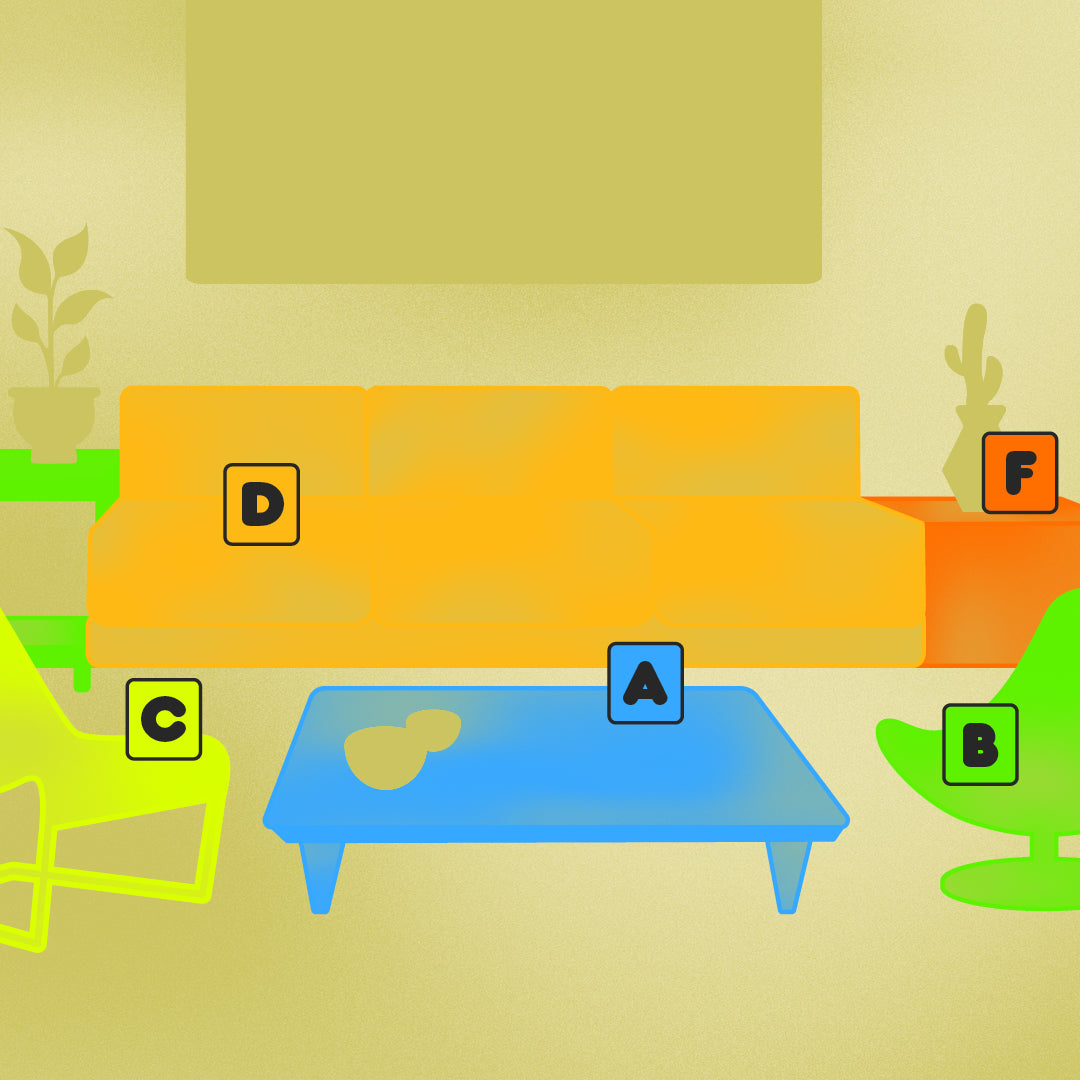
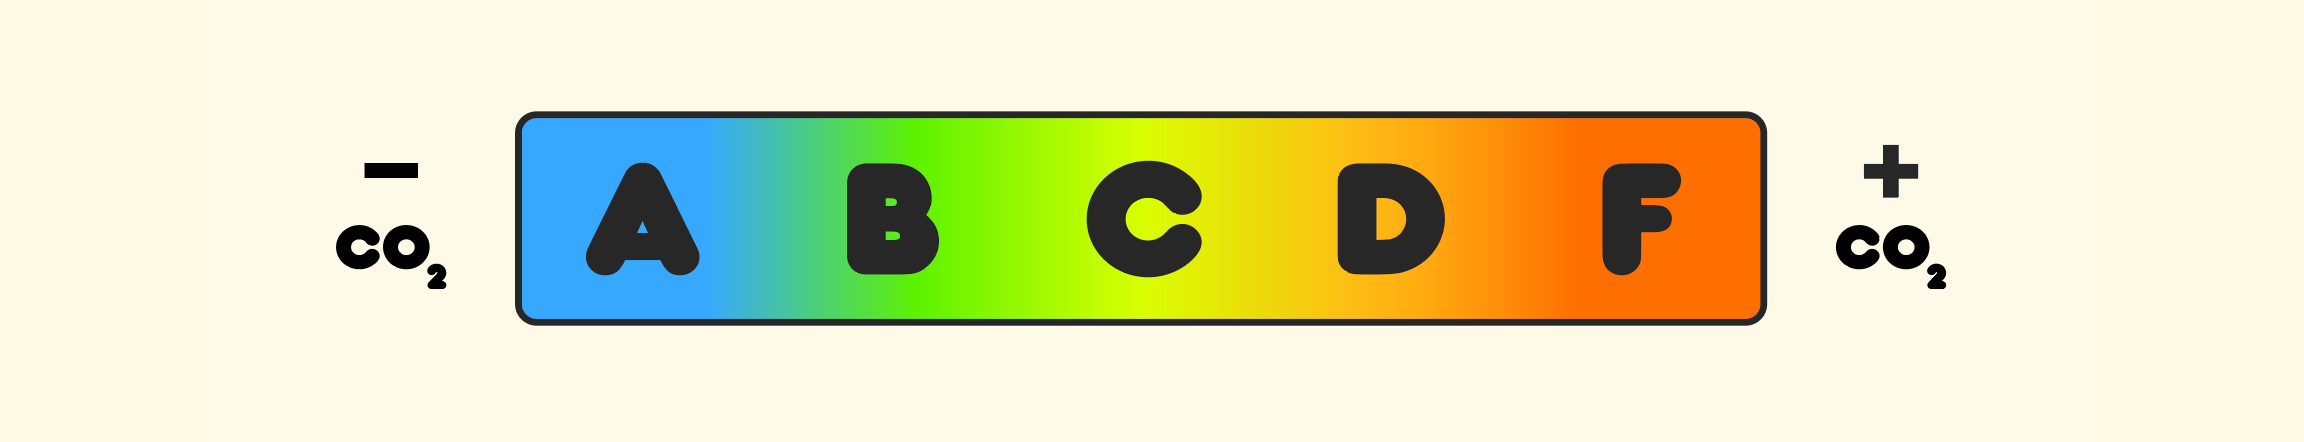
Our own kind of heat map
Our Grades reflect the impact CO2 has on global warming. We map the grades on a heat map to remind you that Grade A products contribute to building a future with a comfortable and cool temperature for all, while Grade F products are contributing to a hot and dangerous climate.
Everything is relative though, our grades are constantly updating. The best you can do for the environment is to only shop for what you truly need - and make an effort to choose low carbon when you do.
Read more below about how we structure our grades to understand how Loopa Grades can help you shop better.
Pre-Verified Impact Labels
Grading Structure
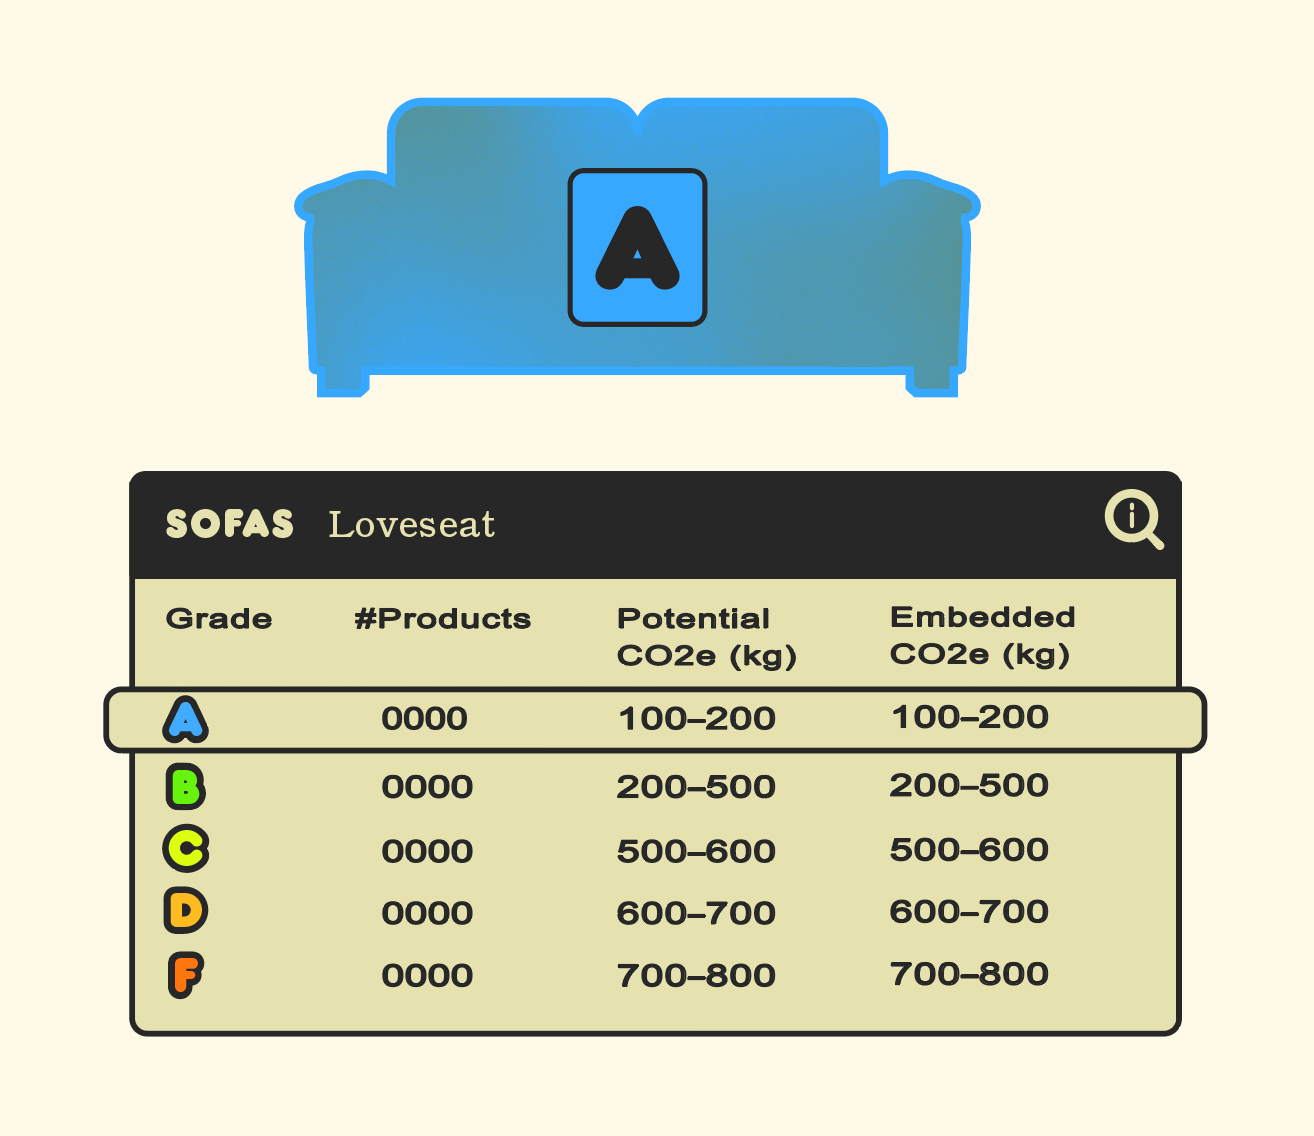
We compare products within the same category only - determined by their shape and size. Subcategories prevent our grades from being solely dependent on product size.
We grade on an A - F spectrum. Grades A, B & C include the top 40% of the category variance and D & F include the bottom 60%. The range starts at the lowest product footprint to promote healthy competition.
Our Grades are based on Potential CO2 estimates, which include measures across the full lifecycle of each product. Embedded CO2 is an estimate of the impact during production and distribution only.
What is included?
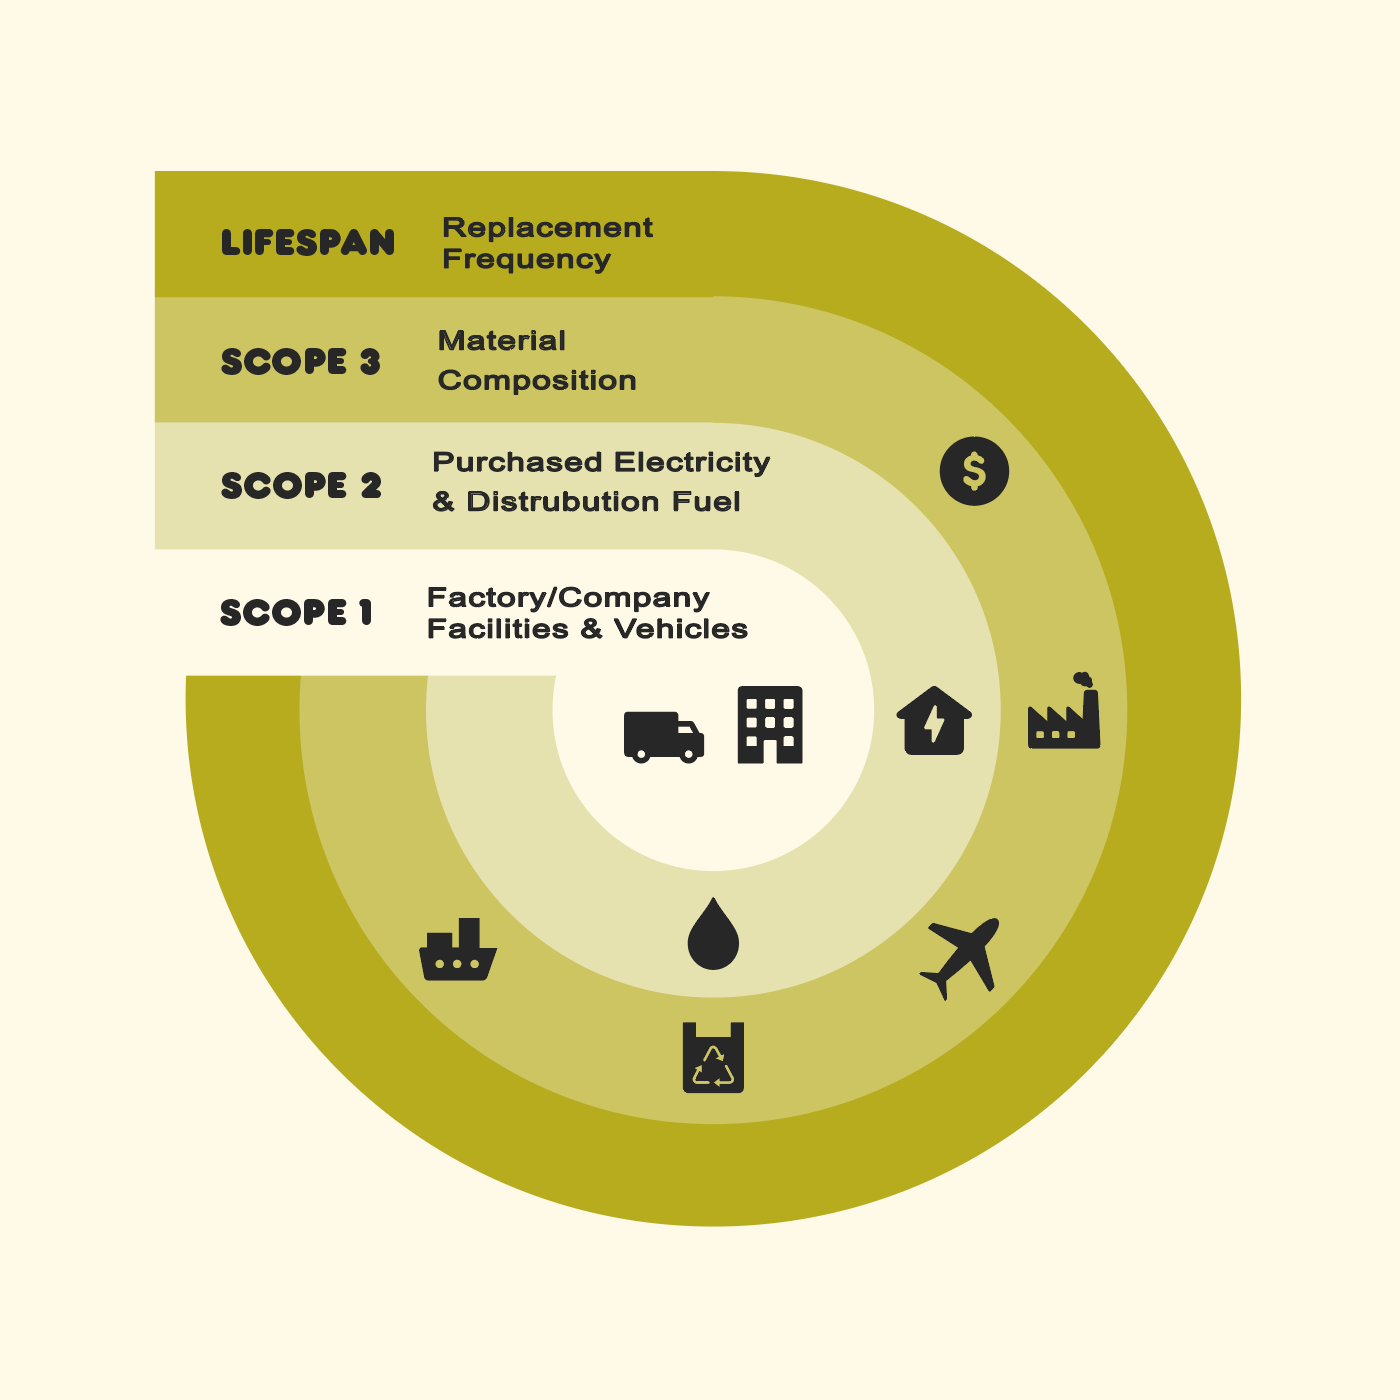
Loopa Grades consider the full lifecycle of a product. The results are primarily driven by 4 key aspects spanning scopes 1, 2 and 3 and product lifespan. We make sure to include product durability to acknowledge the impact of fast furniture.
In terms of lifespan - our model conservatively considers a normal item lifespan of 20 years. Low quality items are estimated to need replacement more frequently. As such, their impact is multiplied to account for the replacements needed within a 20 year timeframe.
Our estimates for fuel consumption in distribution currently always use New York, USA as a delivery location. This location was selected to start as it is the largest city in the USA - the largest consumer of furniture goods in the world, with aprox 40% of recorded global furniture sales.
In addition to fuel consumption and product lifespan, we aggregate data from secondary databases to estimate energy consumption and material composition driven CO2 impact.